Production data pipeline
OPC UA → Postgres → Grafana for a Central-Valley packaging line. Real-time production monitoring across three machines.
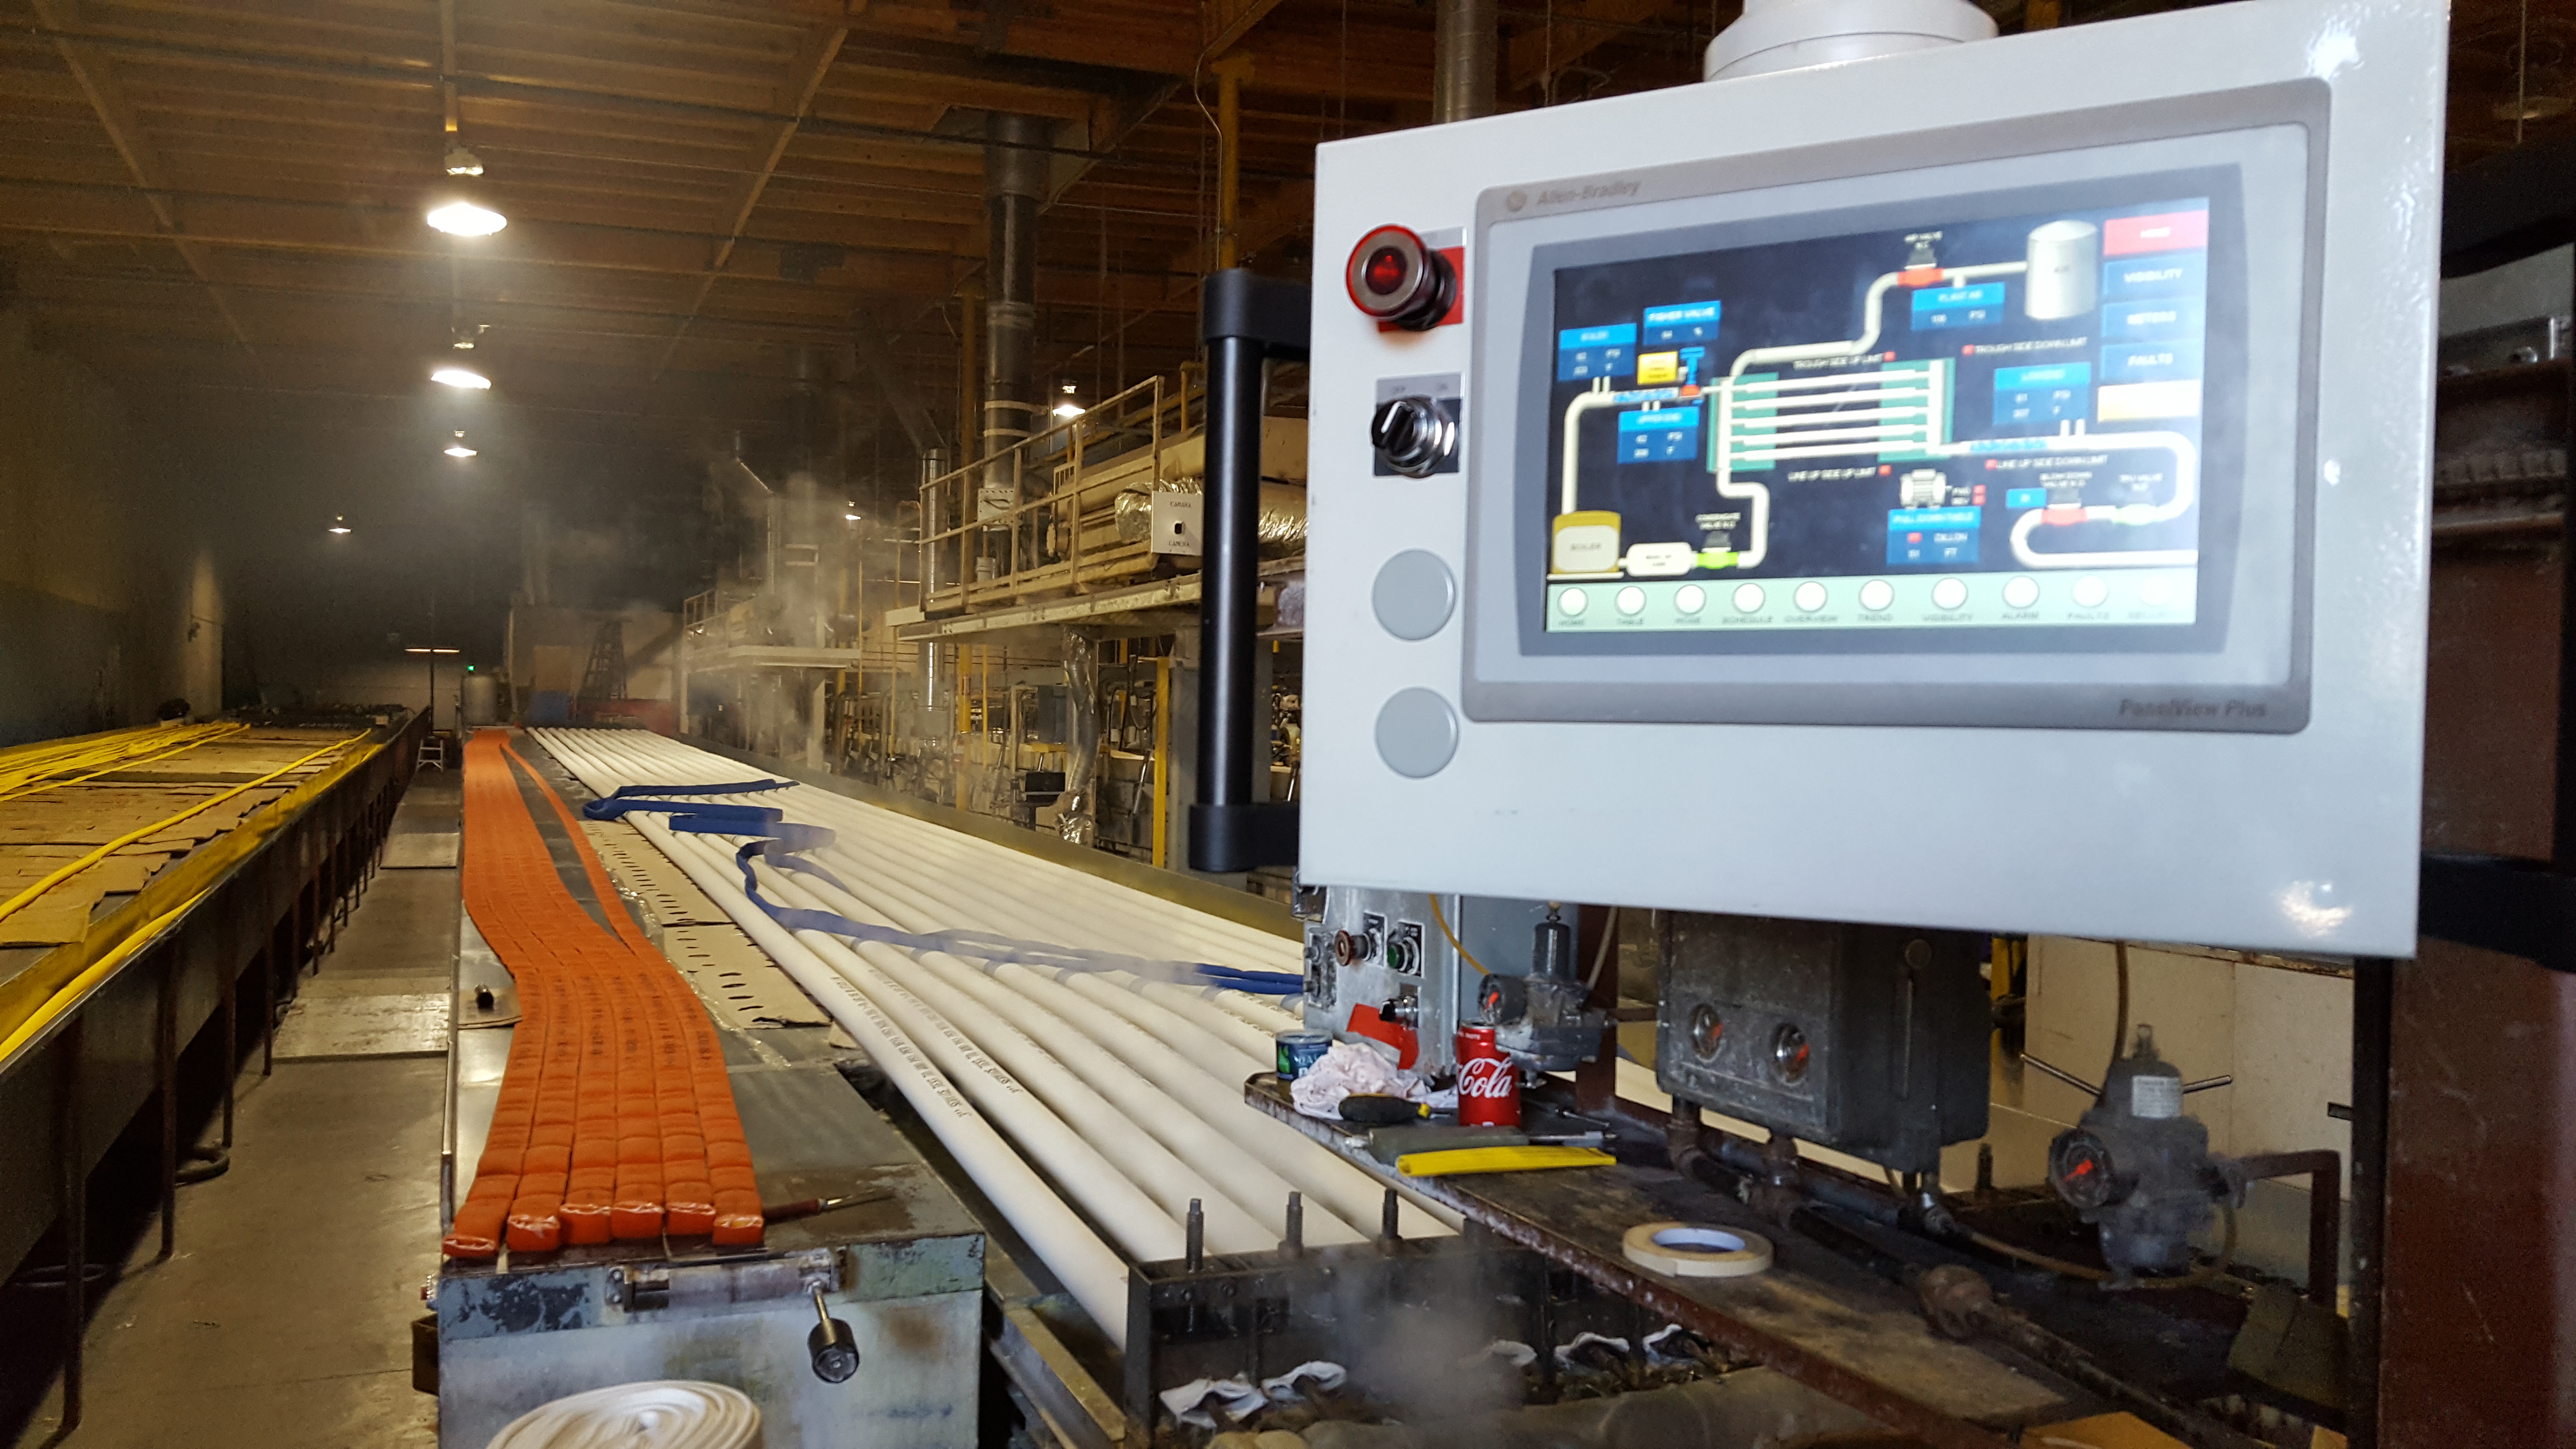
A Central-Valley packaging shop had three Allen-Bradley CompactLogix lines reporting nothing to the office. Output, downtime, and reject counts lived inside the PLCs — the floor knew them in real time, but management saw them once a week in a hand-keyed spreadsheet.
We stood up an OPC UA server in front of the three PLCs, defined a tag map for the production-relevant signals, and streamed them into a Postgres time-series schema. A small Grafana board sits on top with per-machine throughput, downtime stacking, and a rolling-seven-day view for shift handoffs.
Office now sees the same numbers as the floor, with under a minute of latency. The customer eliminated the weekly hand-keyed report — three hours of labor a week — and used the new visibility to identify a recurring jam on Line 2 that had been costing roughly six hours of run-time per month.
Stack & notes.
Stack
- PLCs: Allen-Bradley CompactLogix L33ER, Studio 5000 v33
- Bridge: OPC UA server pulling from the three PLCs over Ethernet/IP
- Database: PostgreSQL with TimescaleDB hypertables for the high-frequency tag history
- Dashboard: Grafana 10, embedded on the office intranet
Notes
The OPC UA layer means the same pipeline extends to new equipment without touching the PLC programs. Adding a fourth machine is a tag-map change, not a PLC rebuild.
Want a similar build for your operation? Tell us what's different and we'll scope it.